I'll be home for Christmas
Data Visualization, 2012
Concept, design and programming of a visualization of US flight data evolved during 72 hours of Visualizing Global Marathon 2012 which won in the infographic category.
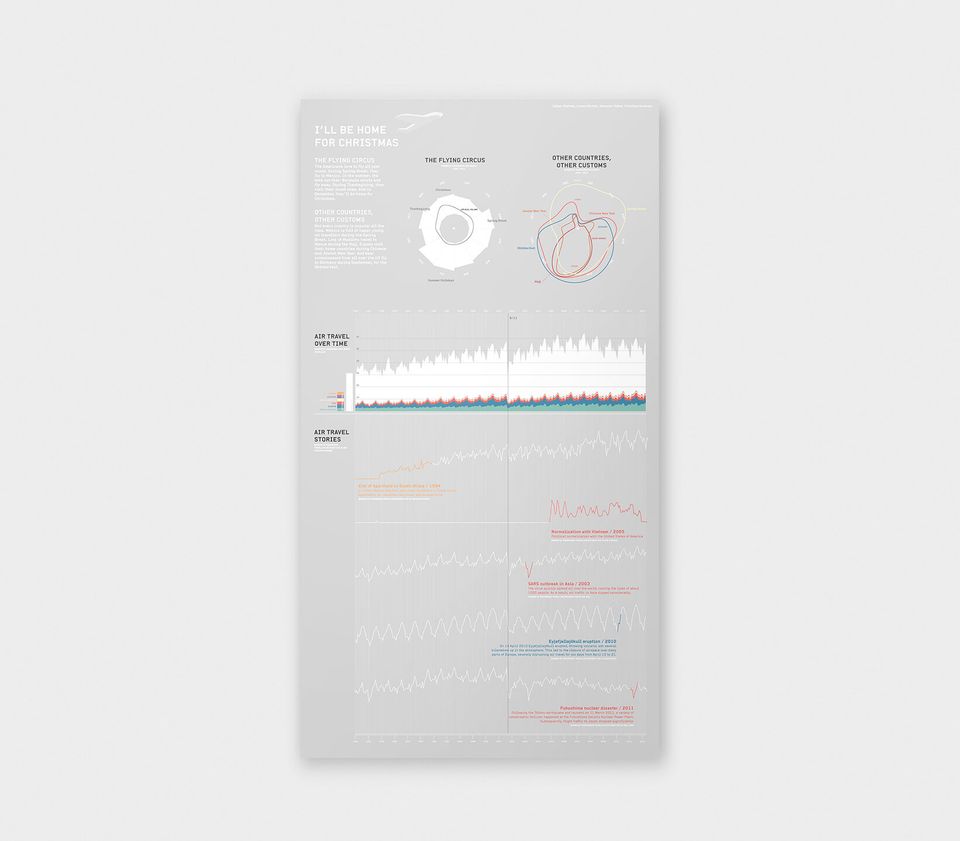
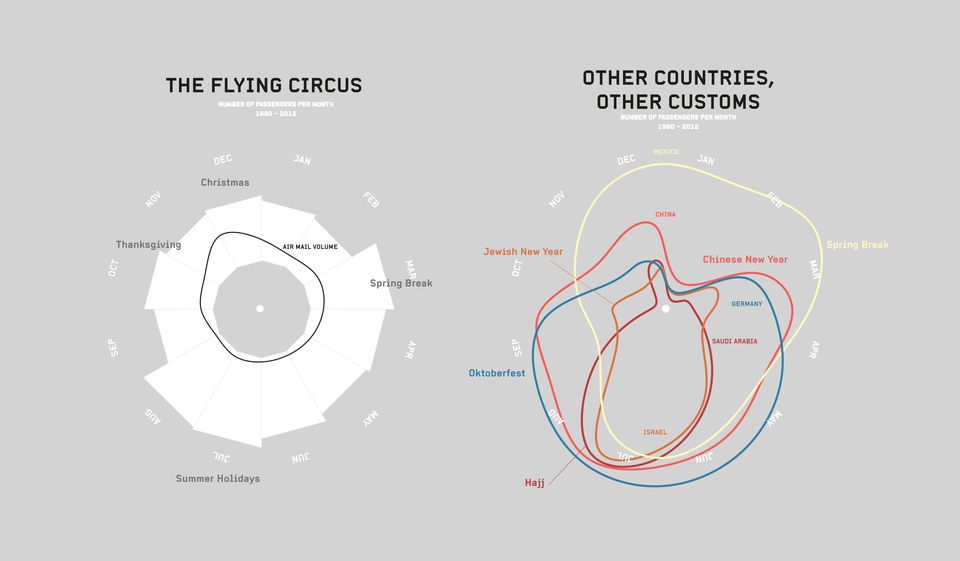
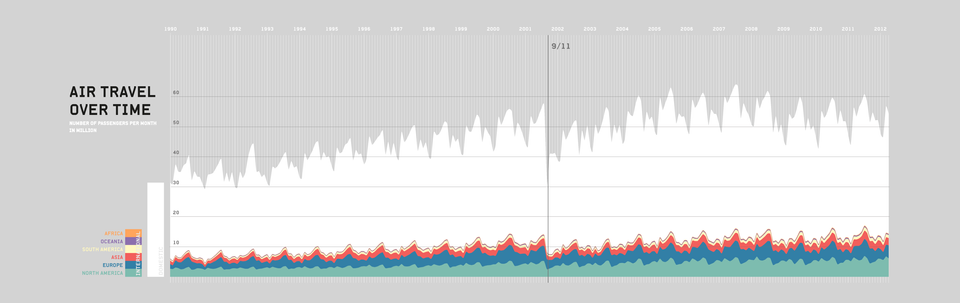
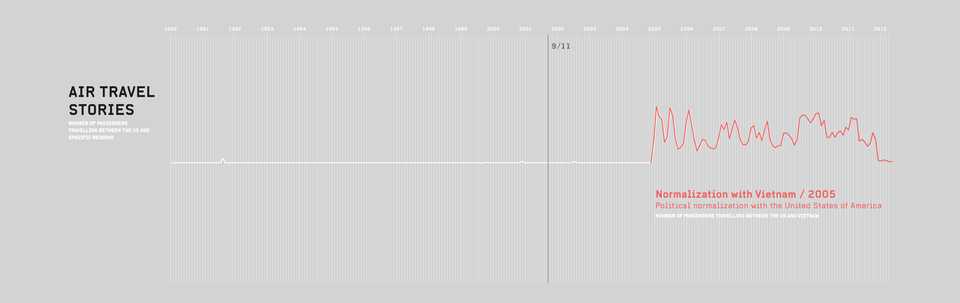
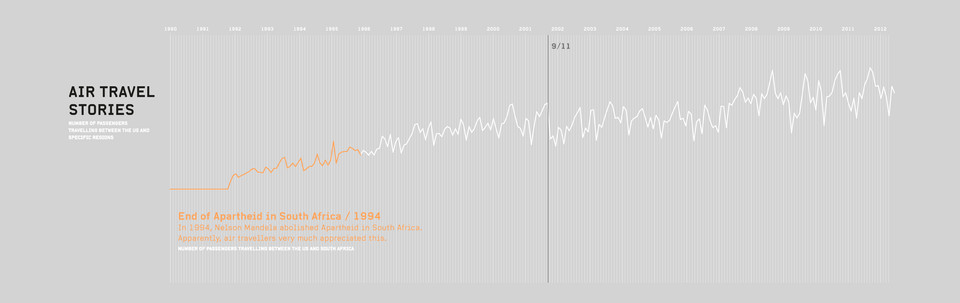
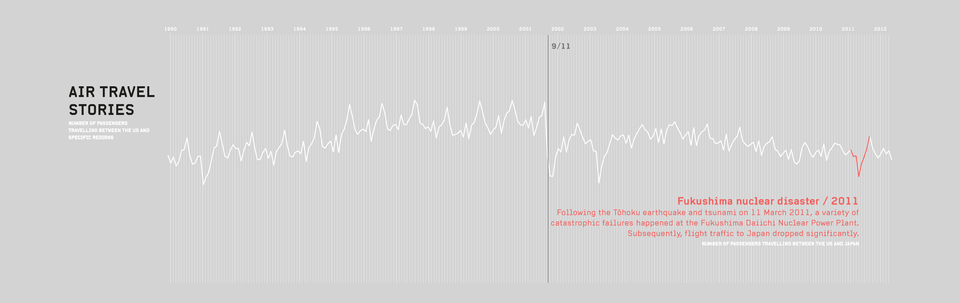
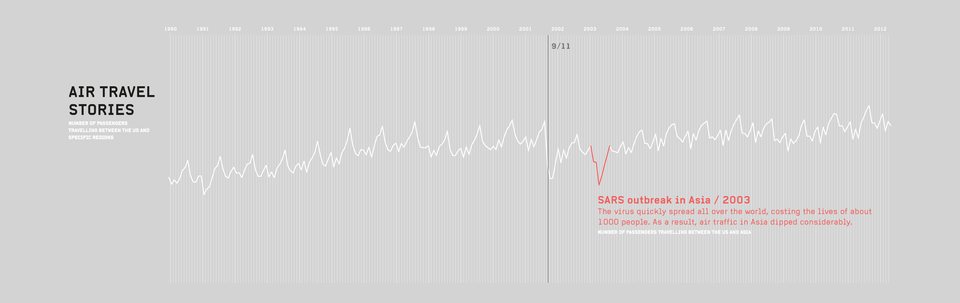
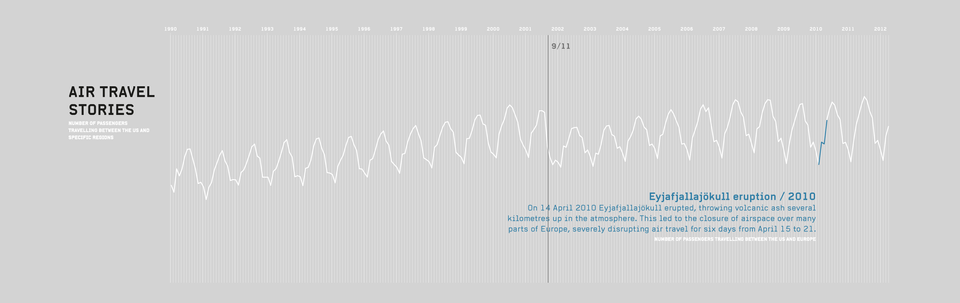
The main idea was to relate the given data set to worldwide recurring events and customs like holidays and vacation times as well as to exceptional events like 9/11. Looking at the data this way we could find both certain patterns and disturbance of these patterns during the last 20 years.
In the end we generated a set of information visualizations and gathered them into a poster named »I’ll be home for Christmas«. The challenge was to find a certain question, that could be answered with the data set of worldwide flight traffic, and to create a proper design of these insights within two days of a very intense weekend.
Technology
#MySQL, #D3.js
Credits
Collaboration with Lionel Michel, Tina Serowski and Julian Stahnke